
By Jessica Irving Marschall, CPA, ISA AM
President and CEO, The Green Mission Inc. and GM-ESG ~ August 2026
Every deconstruction appraisal we complete at The Green Mission Inc. rests on a single economic question: what would a willing buyer pay a willing seller for this material in its most relevant secondary market? In other words, the IRS official definition of Fair Market Value. This is the value upon which a donor can usually donate reclaimed building materials for a non-cash charitable contribution on individual or corporate taxes.
Answering that question of FMV quantitively requires more than familiarity with salvage yards and architectural resale outlets. We maintain an internal database tracking sales from secondary sources over the past almost seven years. We are able to tether value to closed comparable sales and firm offers of sales from multiple secondary retailers. In addition to comparable sales metrics for used materials, our valuation requires a disciplined reading of commodity pricing for new materials, because the price of new lumber, new cabinetry, and new appliances often establishes the ceiling beneath which secondhand prices form on the supply and demand curve, and it requires close attention to the structural growth of the resale economy itself, because demand in that economy determines how close to the ceiling salvaged goods can climb. There is always the exception of reclaimed antique lumber, which often has a value significantly higher than newly milled lumber and because some of it (think Southern Heartpine salvaged from Alabama from 1765) will never exist again in new form!
The data emerging in 2025 and 2026 tell a consistent story on both fronts. New material prices remain elevated and tariff exposed, the secondhand market is expanding at double digit rates across nearly every category we track, and realized prices for quality salvaged goods are moving upward. This article walks through the evidence, beginning with lumber, extending across the broader used goods economy, and concluding with what we are observing in our own appraisal practice and where we predict pricing is headed.
Where Lumber Prices Stand in Mid 2026
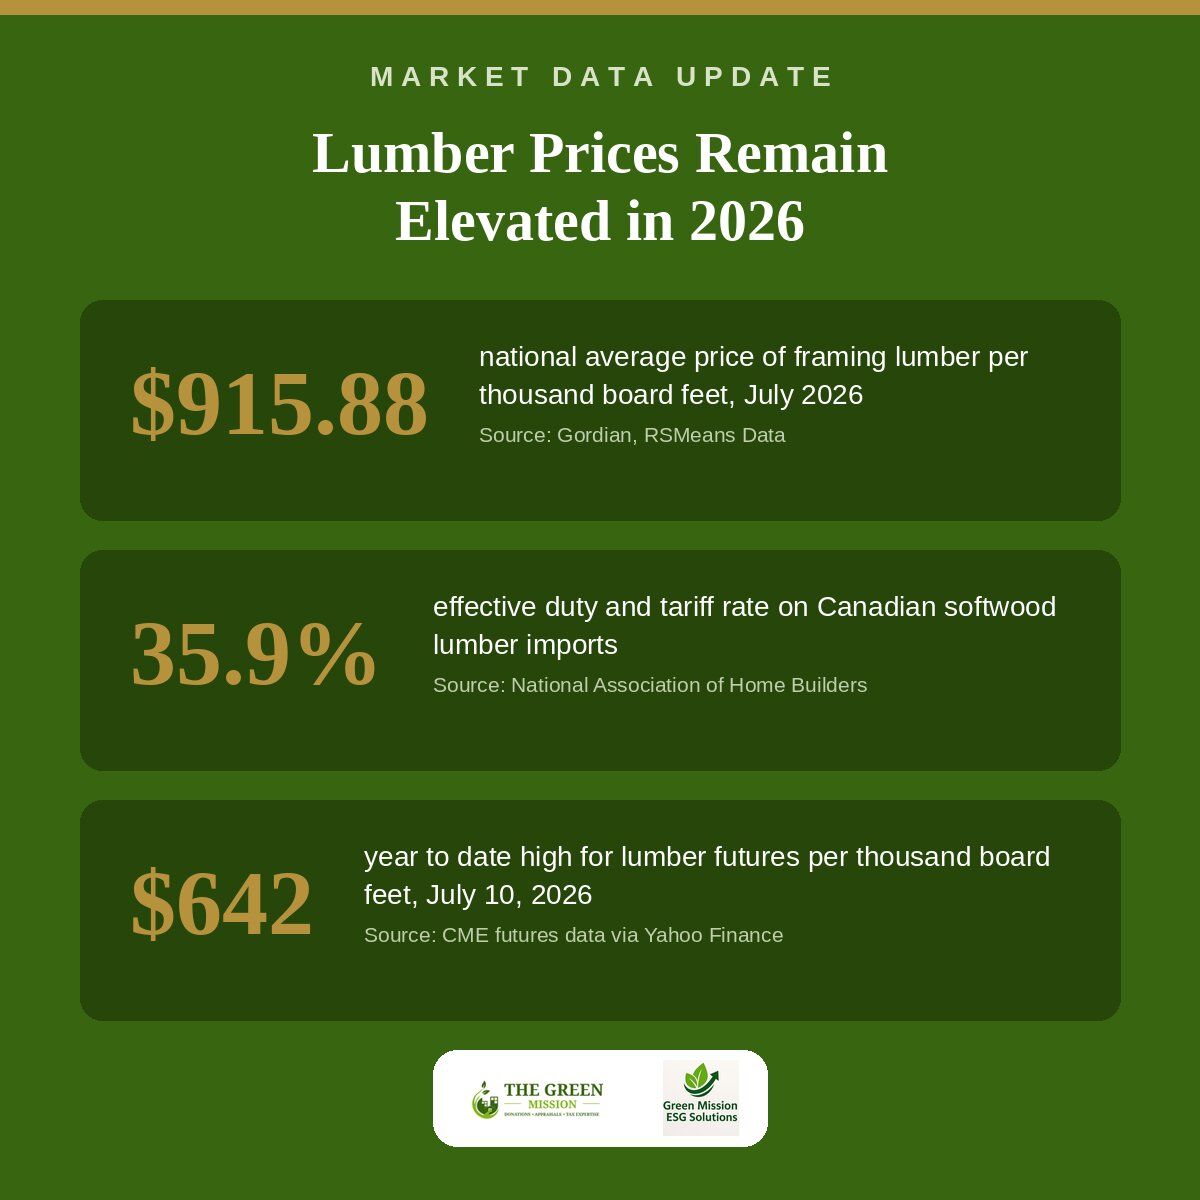
Gordian, publisher of the RSMeans construction cost database, reports a national average framing lumber price of $915.88 per thousand board feet as of July 2026, a figure that is essentially flat against the prior quarter and 2.15 percent below the same point last year. That modest annual decline is notable chiefly because it ends a streak of nine consecutive quarters of year over year price growth. The pause, however, is confined to framing lumber. Over the same quarter, Gordian’s data show plywood products jumping eleven percent and pine boards rising three percent, so the broader wood products complex continues to push higher even as dimensional framing stock catches its breath.
The path to today’s price level is worth recounting because it explains why salvaged lumber has become such a meaningful asset class. Gordian’s quarterly record shows framing lumber climbing seventeen percent over the twelve months ending in January 2025, a surge its analysts attributed in part to tariffs and to mill closures in Canada and reduced capacity in the southern United States. Prices continued upward through 2025, reaching $936.05 per thousand board feet in July of that year, before easing modestly and then rebounding 5.11 percent in the second quarter of 2026. For longer perspective, the same dataset recorded a 162 percent increase in framing lumber between the fourth quarter of 2019 and April 2021, an episode the National Association of Home Builders estimated was adding roughly $24,000 to the cost of a new single family home at its peak.
Weekly market data confirm that the current market is firm rather than falling. The National Association of Home Builders, drawing on Madison’s Lumber Price Index, reported on July 27, 2026 that cash lumber prices rose 1.4 percent in the most recent week and stood 3.1 percent above the prior month, while lumber futures were up 3.0 percent for the week and 4.7 percent for the month. Futures market commentary published through Yahoo Finance and Barchart fills in the trading details: physical lumber futures settled 2025 at $576 per thousand board feet, a 4.63 percent annual gain, rallied to $618.50 in late January 2026, and reached a year to date high of $642 on July 10, 2026. Analysts in that coverage note that lumber remains highly sensitive to interest rates, since demand strengthens when mortgage and construction financing costs fall, and that the market has traded between roughly $450 and $712 per thousand board feet since August 2022, still well below the record $1,711.20 touched by the former random length contract in May 2021 but structurally above pre pandemic norms.
Trade policy remains the wild card. NAHB reports that preliminary determinations announced in the summer of 2026 would lower the combined antidumping and countervailing duty rate on Canadian softwood lumber from 35.2 percent to 25.9 percent, with the antidumping component falling from 20.6 percent to 10.7 percent. Because the ten percent Section 232 tariff remains in place, the effective rate on Canadian imports would still be approximately 35.9 percent. Duties of that magnitude on the largest foreign supplier of framing lumber keep a durable floor under domestic prices. NAHB also reminds us how much wood is embedded in housing: the average new single family home consumes roughly 15,000 board feet of framing lumber along with more than 2,200 square feet of softwood plywood and 6,800 square feet of oriented strand board, and materials cost increases are ultimately marked up nearly fifteen percent by the time they reach the final home price.
Why New Material Prices Matter for Salvaged Materials
For an appraiser valuing the components recovered through deconstruction, these commodity dynamics feed the market for reclaimed lumber. Fair market value for salvaged dimensional lumber, sheathing, flooring, and timbers is often anchored by the cost of the new equivalent, adjusted for condition, and whether is it donated pre or post-denailing and with how much processing labor, and the character of the relevant resale market. These factors are baked into the sales data we study and upon which we conclude appraised value. When new framing lumber trades above $900 per thousand board feet at the national average, and when tariffs of nearly thirty six percent constrain the import supply that would otherwise relieve price pressure, reclaimed structural material becomes more valuable to builders, remodelers, and homeowners. Certain categories of salvaged wood, including old growth heart pine, chestnut, longleaf timbers, and wide plank flooring, carry an additional premium because no new equivalent exists at any price, and their valuation draws on the specialty reclaimed lumber market rather than the commodity index. Even so, the commodity index sets the valuation quantitative framework, and our internal tracking and comparable sales database metrics mid 2026 supports significantly valuable IRS defined Fair Market Value.
The Secondhand Economy Has Gone Mainstream
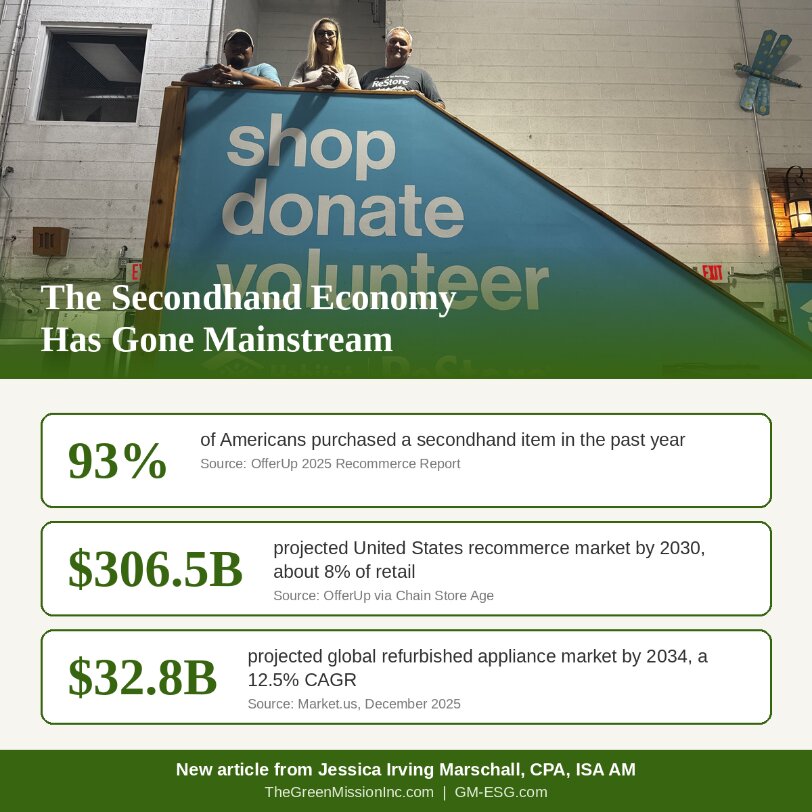
The demand side of the equation is at least as compelling as the supply side. OfferUp’s 2025 Recommerce Report, summarized by Chain Store Age, found that 93 percent of Americans purchased a secondhand item within the past year and that more than half sold one, with the United States recommerce market projected to grow 34 percent by 2030 to reach $306.5 billion, or roughly eight percent of total retail spending. Just as important for our purposes, that report emphasizes that apparel, which dominates the public conversation about resale, represents only about a quarter of the resale market; the balance is a multi-category economy of furniture, appliances, electronics, tools, and home goods, which is precisely the territory where deconstruction generated inventory competes. Seventy percent of respondents said the stigma around secondhand purchasing has faded, 79 percent shop secondhand to save money, and 69 percent report becoming more likely to buy or sell used goods when the economy feels uncertain.
Independent market sizing points in the same direction. Capital One Shopping’s research compilation, updated in March 2026, estimates the United States secondhand market at $56 billion in 2025, a 14.3 percent annual increase, growing to an estimated $61 billion in 2026 and a projected $74 billion by 2029, with resale having expanded roughly 650 percent since 2018 while traditional thrift and donation channels grew about 37 percent. The same compilation counts more than 25,000 resale, consignment, and not for profit shops nationwide and reports thrift store foot traffic up 39.5 percent between 2019 and 2025. Globally, Maximize Market Research values the secondhand product market at $594.45 billion in 2025 and projects growth at a 13.6 percent compound annual rate to nearly $1.45 trillion by 2032, with furniture identified as one of the core product segments and e-commerce as the fastest growing channel. Industry statistics aggregated by Electro IQ and by the marketing firm Amra and Elma add texture: United States thrift store counts approaching or exceeding 29,000 locations, secondhand furniture sales estimated at $38 billion as of 2023, and consumer surveys in which roughly two thirds of respondents cite rising prices for new goods as their primary reason for buying used.
Resale Prices Themselves Are Rising
Growth in market size would matter little to appraisers if per item prices were collapsing, but the opposite is occurring. Commentary aimed at thrift shoppers, including a December 2025 analysis published by ToniOnThrifting, describes a 2026 environment in which secondhand prices are climbing under the combined weight of surging demand, inflation and tariffs on new goods, rising rent and labor costs for resale operators, and a migration of the best donated inventory toward online platforms, which leaves brick and mortar stores pricing their remaining stock more aggressively. That analysis also highlights a structural change we consider highly significant: resale operators are abandoning flat, gut feel pricing in favor of data driven methods that price each item on brand, condition, and observed market comparables.
Guidance published for resale operators confirms the professionalization of pricing. Circular, a resale software provider, counsels stores to replace uniform percentage of retail pricing with tiered category multipliers, condition grade matrices, value based pricing for high demand items, and scheduled markdowns tied to days on shelf, and to check completed sales on platforms such as eBay and Poshmark weekly. It reports typical gross margins of 45 to 55 percent for general thrift inventory and 60 to 65 percent for higher end consignment. For appraisal practice, the spread of comparable driven pricing throughout the resale trade is quietly transformative, because it means the secondary market is generating deeper, cleaner, and more current sales evidence every year, which strengthens the substantiation behind fair market value conclusions.
Appliances and Cabinetry: Two Categories We Watch Closely

Two categories deserve particular attention because they represent a large share of the value recovered in residential deconstruction and donation projects. The first is appliances. Market.us, in a December 2025 report, sizes the global refurbished appliance market at $10.1 billion in 2024 and projects it to reach $32.8 billion by 2034, a 12.5 percent compound annual growth rate, with home appliances representing about two thirds of the market, residential buyers nearly four fifths, and online marketplaces more than half of sales. The purchase motivations documented in that research align exactly with what we see in donee resale channels: 41 percent of refurbished appliance buyers are motivated primarily by cost savings, and another 35 percent are pursuing access to premium products at reduced prices. That second figure is the important one. Demand concentrates on premium brands, and in our own appraisal work we are observing correspondingly strong realized prices for donated and resold appliances from the top of the market, including professional grade ranges, built in refrigeration, and premium dishwasher and laundry brands, which routinely command multiples of what comparable mass market units bring. Think Wolf, Viking, Miele, Gaggeneau, Thermador.
The second category is cabinetry. The Freedonia Group values the United States cabinet market at approximately $33 billion in 2024 and projects unit demand to grow about 1.1 percent annually to 135 million units in 2028, with market value expected to grow faster than unit volume, at roughly 2.4 percent per year, because buyers keep trading up to higher value product with enhanced performance and aesthetic features. Freedonia also notes that new cabinet prices spiked during the recent period of supply chain disruption and elevated raw material costs and are moderating only gradually. A full set of new semicustom or custom kitchen cabinetry now represents one of the largest line items in any remodel, and that reality flows directly into the secondary market. In our recent appraisal engagements, complete kitchen cabinet sets in good condition, particularly solid wood and premium manufacturer product, are achieving noticeably higher realized prices at donee resale outlets than the same inventory would have brought several years ago. When the new equivalent costs more and the remodeling public has grown comfortable buying used, well documented salvaged cabinetry sells faster and at stronger prices. By far one of the top secondary market participants here is Sustainability Angels and Aurora Circularity where buyers can purchase a full set of Bulthaup cabinetry and Wolf Appliances for a fraction of the price.
Our Hypothesis: Friction Is the Last Discount
Taken together, the data support a working hypothesis that guides our research agenda at The Green Mission Inc. and GM-ESG. The secondhand market for building materials, fixtures, appliances, and furnishings is large, growing, and increasingly price sophisticated, yet it remains meaningfully less liquid than the markets for secondhand apparel or electronics. A homeowner can sell a designer handbag in minutes through several competing platforms with established authentication, pricing guidance, shipping, and payment infrastructure. Selling a full kitchen of cabinetry, a commercial grade range, or three thousand board feet of reclaimed framing lumber still involves search costs, transportation logistics, condition uncertainty, and thin local markets. That friction is, in effect, the final discount embedded in today’s secondhand prices for these goods.
Our hypothesis is that as the ease of buying and selling in these categories improves, through better marketplaces, richer comparable sales data, professionalized deconstruction supply chains, and donee organizations with growing retail sophistication, realized prices will move higher, and the gap between the value of a used premium appliance or cabinet set and its new equivalent will continue to narrow. The early evidence is already visible in our files: cabinetry and premium brand appliances are the categories where we see realized prices strengthening first, precisely because they combine high replacement cost with improving resale channels. The categories still burdened by the greatest transaction friction are the ones with the most price appreciation ahead of them.
Implications for Deconstruction, Donation, and Appraisal Practice

For property owners weighing demolition against deconstruction, these trends strengthen the economic case for material recovery. Elevated new lumber prices, tariff constrained supply, a resale economy approaching a third of a trillion dollars in projected United States volume, and rising realized prices for the highest value salvage categories all mean that the materials in an existing structure are worth more, in real and defensible IRS defined Fair Market Value, than they were even a few years ago. For appraisers, the same trends raise the standard of care: Fair Market Value conclusions must be grounded in current market evidence, and the market is generating better evidence than ever. We maintain our own internal valuation source data from around 800 secondary retail sources and with hundreds of thousands of data points. This allows us to identify secondary market value increases, like we have over the past 18 months especially. For donee organizations, the message is to keep investing in retail capability, pricing discipline, and online reach, because every improvement in the ease of resale is captured partly as higher proceeds funding their missions.
The Green Mission Inc. will continue to track lumber indices, resale market data, and category level pricing on a quarterly basis and to incorporate that research into every IRS qualified appraisal we produce along with our internal proprietary valuation database. The secondhand economy has moved from the margins of American commerce to its mainstream, and the value of what we save from the landfill is rising with it.
Sources
Gordian, What the Data Says: Lumber Price Updates (Updated July 2026)
National Association of Home Builders, Framing Lumber Prices (Published July 27, 2026)
Yahoo Finance / Barchart, What are the Prospects for Lumber Prices? (2026)
Chain Store Age, U.S. Resale Market to Reach $306 Billion by 2030 as Secondhand Shopping Goes Mainstream (September 25, 2025)
Capital One Shopping Research, Thrifting Statistics (Updated March 3, 2026)
Maximize Market Research, Second-hand Product Market: Global Industry Analysis and Forecast (2026–2032)
Market.us, Refurbished Appliance Market Size, Share, Growth Analysis (December 2025)
The Freedonia Group, US Cabinets Market Research and Forecast Analysis (2024–2033)
Circular, Pricing Strategies for Secondhand Stores (2026 Guide)
ToniOnThrifting, 2026 Thrift Store Price Trends: What Shoppers Should Know
Electro IQ, Thrifting Statistics by Market, Consumer, Shoppers and Facts (Updated May 2026)
Amra and Elma, Top 20 Thrift Store Marketing Statistics 2026 (Updated March 2026)
